ATI Radeon CrossFireX Review - Benchmarking
The HD 5770 and HD 5850 contain the same connections as the original HD 5870 - 1x HDMI, 1x DisplayPort and 2x DVI. As with the HD 5870, each card was connected with a DP-DVI-DVI configuration. The 5870 E6 has six mini-DP connections. I used three mini-DP>DP cables. Configuration of the Eyefinity group within the Catalyst Control Center works as previously outlined. Bezel Compensation continues to work in the same manner. Both of these features are software based, and not dependent on the individual card. For all 16:10 benchmarks I used my existing three Dell U2410 monitors. The 10.6 driver was used for all cards. The original E6 benchmarks were updated with the new driver, though there were only changes in a few places. My testing rig remains unchanged (except for driver updates and monitor configurations). It currently stands at: Note: I do not have two original 5870 cards. I paired an E6 card with my original 5870. This effectively produces the same results as a pair of original 5870s in CFX, as only 1GB of VRAM is used on the E6 card. I initially tested at 1920x1200 and 1680x1050, along with the respective 3x1-L iterations of 5760x1200 and 5040x1050. These are the most common resolutions for single screen and Eyefinity. Setups based on 1920x1080 or 1600x900 panels are becoming popular as well. In my review of the HD 5870 Eyefinity6, I looked at any performance difference between 16:10 and 16:9 screens. The differences were minimal, if any. I wanted to choose games that covered a variety of genres (action, FRP, RTS and racing), and a variety of technologies (DX9, 10 and 11). Some games are older and well known titles such as Half-Life 2 and Far Cry 2. Half-Life 2 chews through video cards at lower resolutions and even 3x1-L, but how does it scale to five and six monitors? Far Cry 2 is still tough on systems (at Ultra settings). Will it even be playable at these new configurations. I also wanted to test games that were new and demanding, so that we can begin "aging" them over time. I chose titles such as Battle Forge and the new S.T.A.L.K.E.R. demo for these reasons. I chose games that had a built-in benchmark tool. This allows for repeatability and a relative "hands off" testing. Finally, all games must exhibit Hor+ behavior in widescreen and Eyefinity. The games I ended up testing were: System Specs
Resolutions Tested
Games Tested
ATI Radeon CrossFireX Review - Batman: Arkham Asylum
CrossFireX Scaling
| HD 5870 E6 2GB CFX | ||
| 1680x1050 | 1920x1200 | |
| WS | 62% | 69% |
| EF | 38% | 41% |
| HD 5870 1GB CFX | ||
| 1680x1050 | 1920x1200 | |
| WS | 58% | 67% |
| EF | 35% | |
| HD 5850 1GB CFX | ||
| 1680x1050 | 1920x1200 | |
| WS | 75% | 82% |
| EF | 44% | |
| HD 5770 1GB CFX | ||
| 1680x1050 | 1920x1200 | |
| WS | 82% | 88% |
| EF | 68% | |
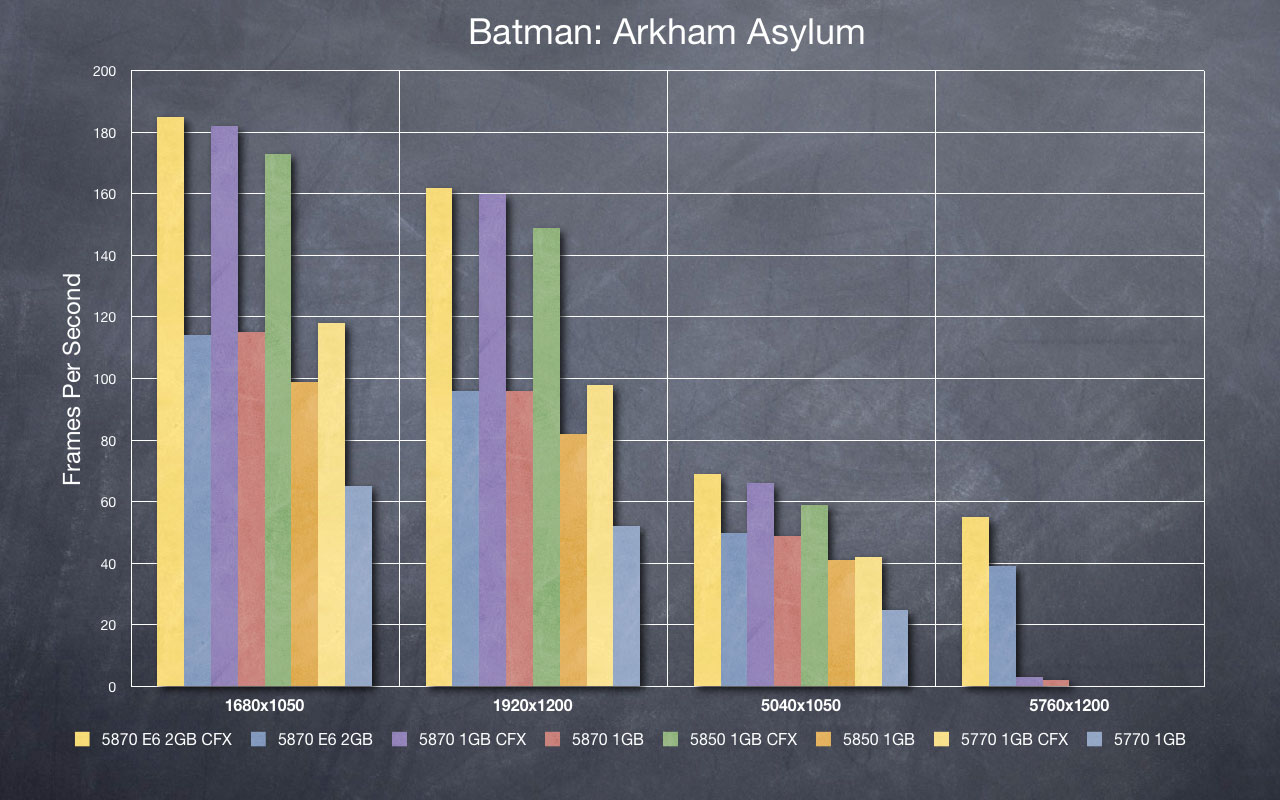
Batman: Arkham Asylum is the well received action title by Rocksteady. The game offers very detailed environments with a great visual style and high quality. There are known issues with AA using ATI cards. You cannot set the AA level from within the game, and have to force it with the Catalyst Control panel. All settings within the game were maxed out. I used 4xAA with Adaptive Multi-Sampling (the balance between Quality and Performance) from within the CCC.
The AA implementation produces a greater than expected impact on the performance. I know there are ways to tweak the game to use the AA from within the game itself. However, I believe finding the information and implementing it is beyond the average gamer. While an enthusiast (i.e., target market of both the WSGF and this card) might go through the trouble, many mainstream gamers will not. My testing actually ran all the way down through the Radeon HD 5450, and using the "native" options provided the most consistent platform for testing.
The games runs like a demon in normal widescreen on any of these cards, with 4xAA. The HD 5770 almost cracks 60fps at 1920x1200. However, performance takes the expected hits in Eyefinity, and this is what we are really here to test. At the native resolutions of 5760x1200 (3x1920x1200), the game literally crawls with 4xAA on any card. You will have to make some adjustments for playable frame rates, and dropping to 2xAA gives massive speed improvements.
Batman:AA (pun actually not intended) is a unique title. It is made well, and plays well, but technical issues can really hamper performance. The impacts are so great that 5760x1200 is simply unplayable with any card.
The four cards offer strong scaling in widescreen - but it is overkill for all except the 5770. CFX continues with noticeable improvements in Eyefinity, but the AA performance hits overshadow the scaling. For better performance in Batman, the first step is to reduce the AA. All of the configurations perform and scale better when the AA impact is removed.
ATI Radeon CrossFireX Review - Battle Forge
| HD 5870 E6 2GB CFX | ||
| 1680x1050 | 1920x1200 | |
| WS | 81% | 87% |
| EF | 77% | 73% |
| HD 5870 1GB CFX | ||
| 1680x1050 | 1920x1200 | |
| WS | 79% | 87% |
| EF | 95% | 67% |
| HD 5850 1GB CFX | ||
| 1680x1050 | 1920x1200 | |
| WS | 89% | 87% |
| EF | 73% | 50% |
| HD 5770 1GB CFX | ||
| 1680x1050 | 1920x1200 | |
| WS | 89% | 88% |
| EF | 85% | 50% |
Battle Forge is the free-to-play RTS from Electronic Arts. It offers a steampunk/fantasy RTS experience, where armies are build based on "decks" of cards similar to the Magic: The Gathering card game.
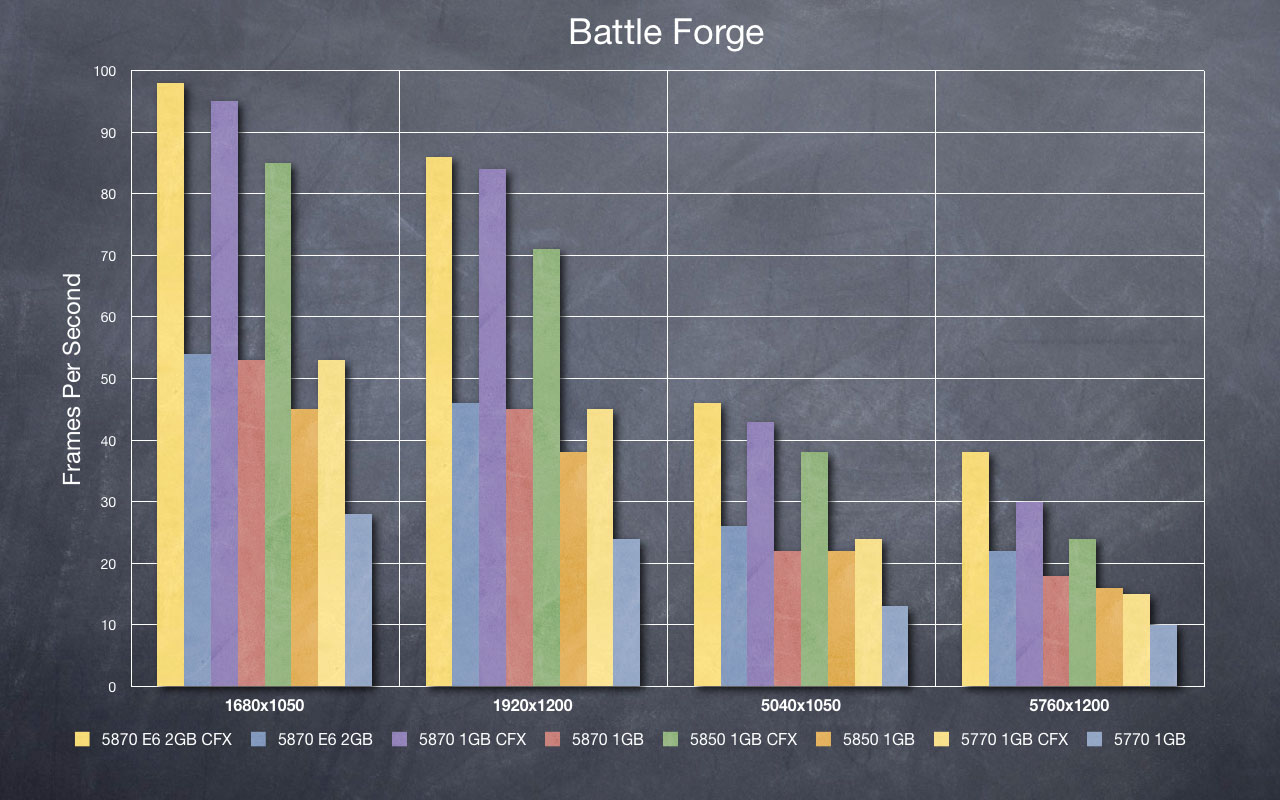
Battle Forge is one of ATI's spotlight (my terminology) games for the HD 5000 series cards, as it offers both DX11 and proper Eyefinity support. The game offers a number of DX11 features, and a wealth of options for tuning performance. Specifically, Battle Forge uses DX11 and Shader Model 5.0 to compute HighDefinition Ambient Occlusion (HDAO). For our tests we maxed out all of the settings and forced DX11 through the config.xml file.
The test is actually quite strenuous with the number of objects, effects and particles on the screen at one time. In most instances, the scaling is averages 80%. The two instances with considerably lesser scaling are the HD 5850 and 5770 at 5760x1200.
ATI Radeon CrossFireX Review - DiRT 2
CrossFireX Scaling
| HD 5870 E6 2GB CFX | ||
| 1680x1050 | 1920x1200 | |
| WS | 50% | 62% |
| EF | 57% | 58% |
| HD 5870 1GB CFX | ||
| 1680x1050 | 1920x1200 | |
| WS | 50% | 59% |
| EF | 55% | 57% |
| HD 5850 1GB CFX | ||
| 1680x1050 | 1920x1200 | |
| WS | 53% | 64% |
| EF | 61% | 63% |
| HD 5770 1GB CFX | ||
| 1680x1050 | 1920x1200 | |
| WS | 71% | 68% |
| EF | 67% | 70% |
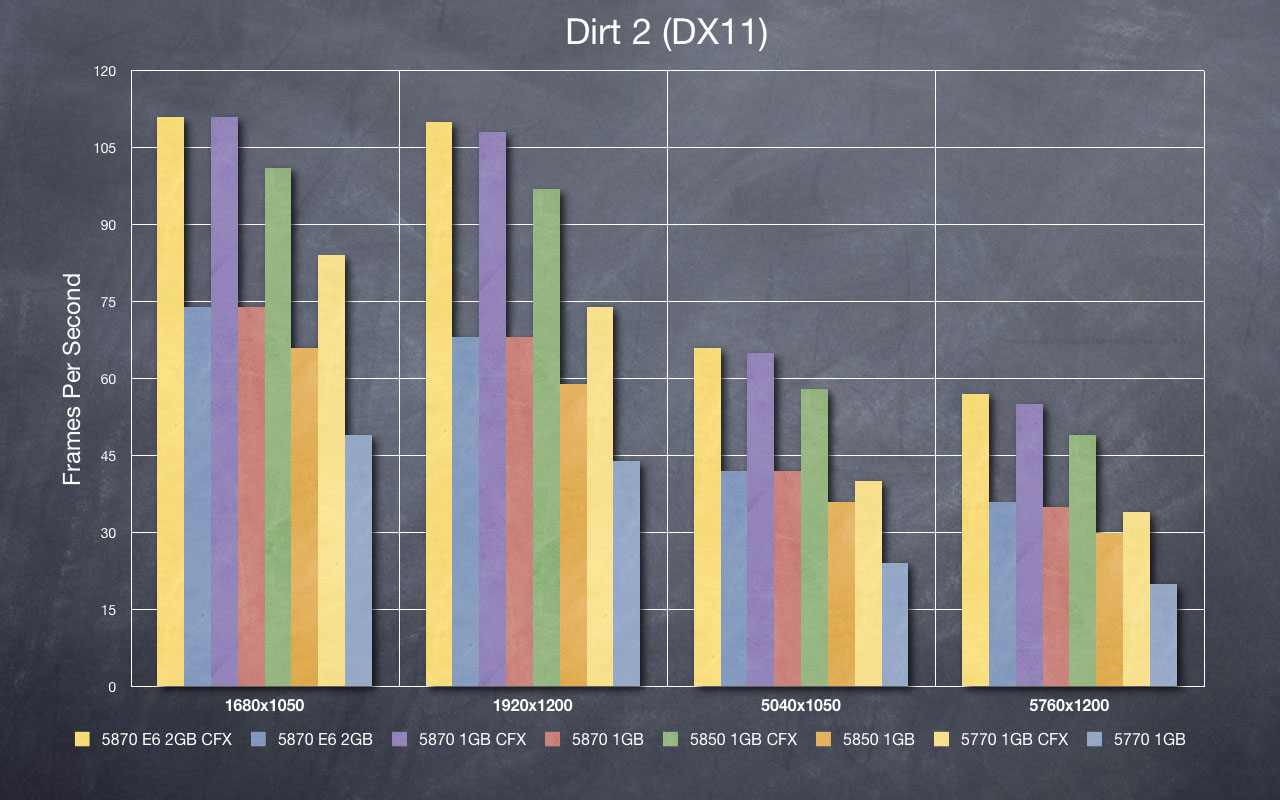
Dirt 2 is the latest iteration of the Dirt rally racing series from Codemasters. Like Battle Forge, Dirt 2 is a spotlight game for ATI with the HD 5000 series. Like Battle Forge it offers proper Hor+ gameplay in Eyefinity and DX11 support. Unless the user goes into the "hardware_settings_config.xml" file and forces DX9, Dirt 2 runs in DX11 mode. Unfortunately Dirt 2 does not offer a DX10 mode. This is unfortunate, as many games show improved performance when running in DX10 vs. DX9.
The true (noticeable) DX11 features come in to play based on the user settings in the in-game graphics options. Several key features are the "Hardware Tessellated Dynamic Water" (achieved through "Ultra" quality water), "Hardware Tessellated Dynamic Cloth" (achieved through "High" quality cloth), and DX11 Accelerated HDAO (through "High" quality HDAO).
The DX11 water and cloth offer more realistic geometry and movement. The DX11 water produces actual waves in deep puddles (as the player drives through), rather than simple "swirls" in the texture surface. The DX11 cloth offers more realistic ripples and waves in the cloth material over the DX9 version. On the other hand, the DX11 HD Ambient Occlusion (HDAO) offers an accelerated computation path.
DX11 doesn't necessarily provide earth-shaking changes to gameplay. But, it provides more realistic "movement" in the world's objects - cloth, water, grass, etc. While a DX9 or DX10 game is perfectly enjoyable, the DX11 technology offers better immersion by making the "little things" more lifelike. Additionally, it offers better computation paths through increased parallelism (and better computation paths for DX10), much like DX10 offered better performance (over DX9) in games such as Far Cry 2.
The scaling is not quite as good as in Battle Forge, but the fps were higher to start with. Slight adjustments would still be needed at the ultra-high end to hit 60fps consistently. The 5800-series cards scale between 50%-60%. The 5770 scales on average 70%, but the numbers start out much lower.
ATI Radeon CrossFireX Review - Far Cry 2
CrossFireX Scaling
| HD 5870 E6 2GB CFX | ||
| 1680x1050 | 1920x1200 | |
| WS | 65% | 70% |
| EF | 70% | 69% |
| HD 5870 1GB CFX | ||
| 1680x1050 | 1920x1200 | |
| WS | 62% | 68% |
| EF | 57% | 58% |
| HD 5850 1GB CFX | ||
| 1680x1050 | 1920x1200 | |
| WS | 76% | 78% |
| EF | 72% | 66% |
| HD 5770 1GB CFX | ||
| 1680x1050 | 1920x1200 | |
| WS | 80% | 73% |
| EF | 79% | 70% |
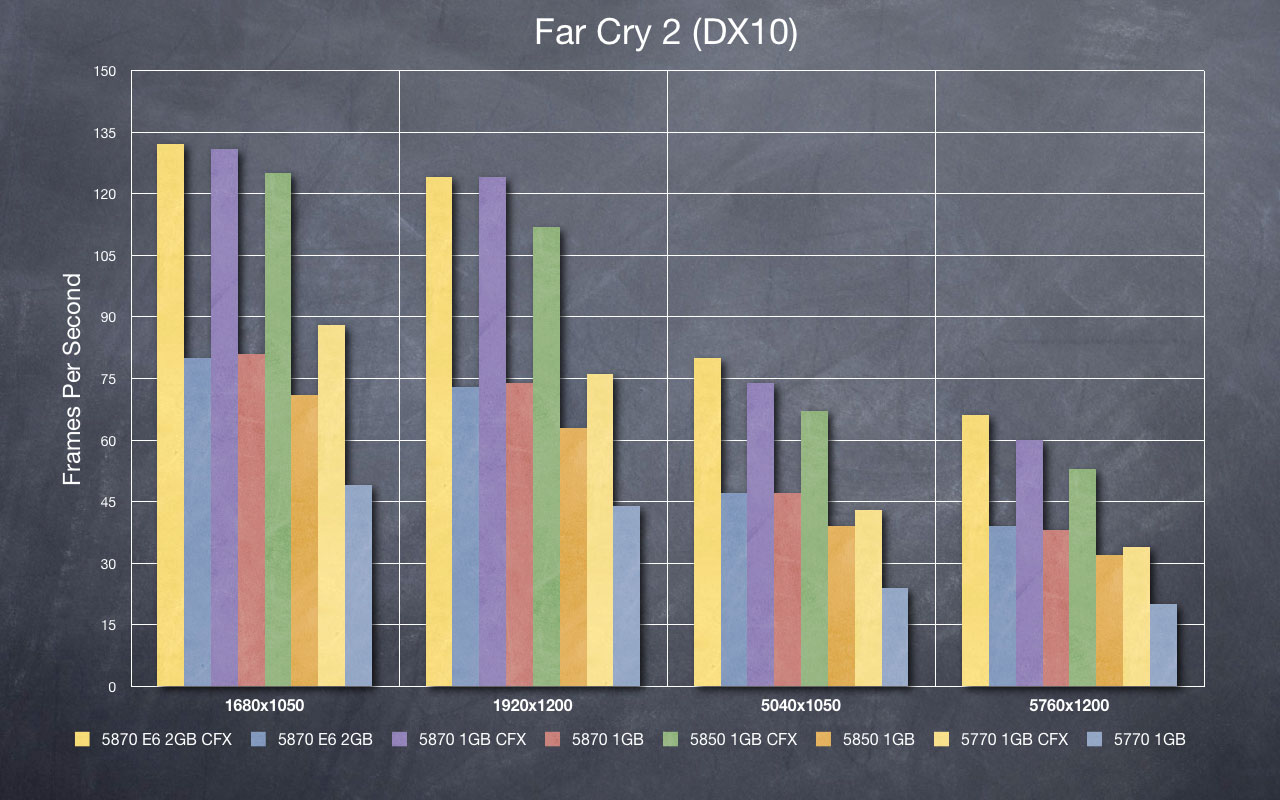
Far Cry 2 (and the whole Cry/Crysis series) has long been considered a system killer. If not a killer, then at least a good strong test. As always, we run our test at max settings with 4xAA. The benchmark tool within Far Cry 2 offers settings for High, Very High and Ultra. We chose Ultra with 4xAA.
While once a true system killer, Far Cry 2 shows that hardware catches up to software. Even a sub-$200 card provides an easily playable experience (though not always at the highest settings). CFX scaled well, and offers solid performance boosts across the line. The pair of 5870 cards scale at 70% and 60%. The 5850 offers 70% scaling on average, and the 5770 offers 75%.
ATI Radeon CrossFireX Review - H.A.W.X.
CrossFireX Scaling
| HD 5870 E6 2GB CFX | ||
| 1680x1050 | 1920x1200 | |
| WS | 67% | 77% |
| EF | 60% | 50% |
| HD 5870 1GB CFX | ||
| 1680x1050 | 1920x1200 | |
| WS | 67% | 71% |
| EF | 39% | 40% |
| HD 5850 1GB CFX | ||
| 1680x1050 | 1920x1200 | |
| WS | 79% | 78% |
| EF | 63% | 68% |
| HD 5770 1GB CFX | ||
| 1680x1050 | 1920x1200 | |
| WS | 78% | 79% |
| EF | 71% | 69% |
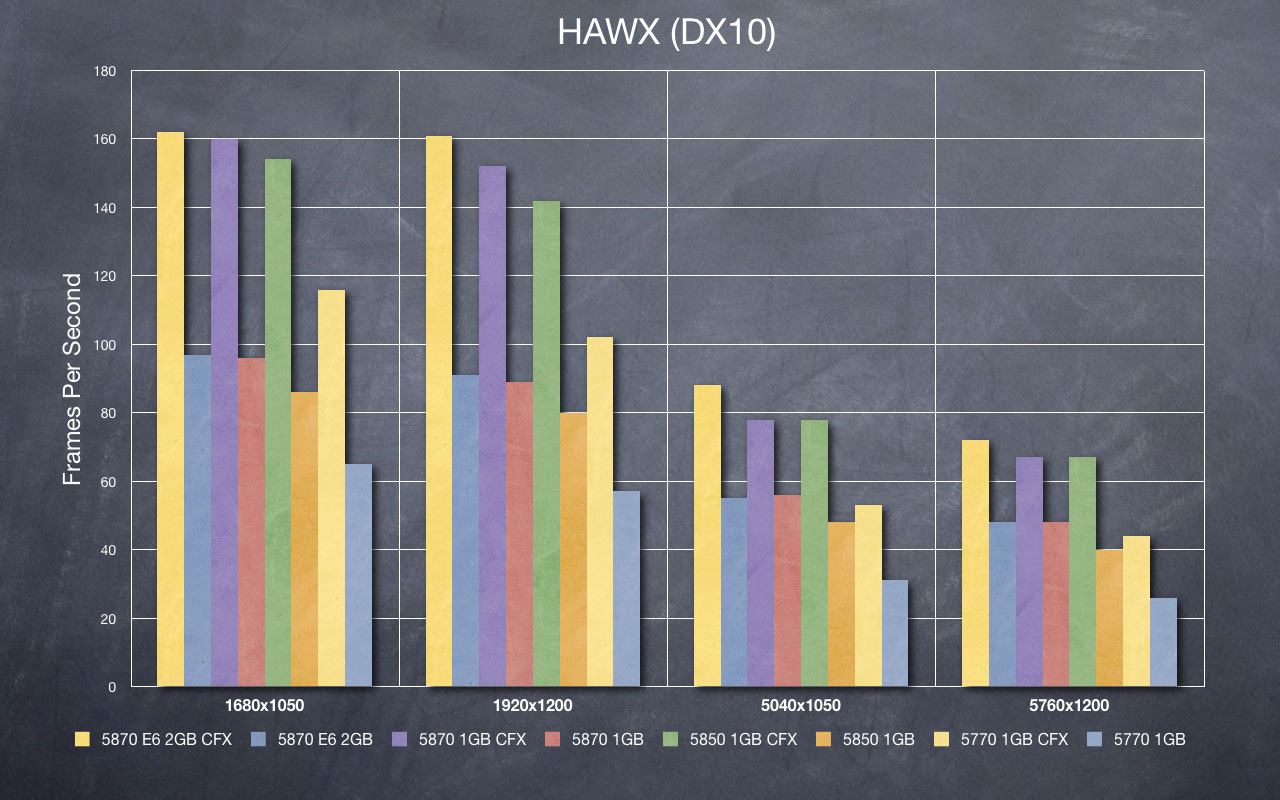
H.A.W.X. is one last title that ATI has been showing off with regards to its Radeon 5000 line. While the other titles are Hor+ and offer cutting-edge DX11 features, HAWX is quite the opposite. While it is a Hor+ title, it is only a DX10 title and runs quite well on a wide variety of hardware. While you can't hit 60fps on a 5700 or 5600 card with any great detail, 30fps is rather easily attainable.
The well running and scalable title makes it a natural fit when showcasing both lower-end hardware pushing three panels, and high-end hardware pushing six panels. It also comes as no surprise that the additional VRAM largely goes unused, considering the title runs capably on lower hardware.
One note in the HAWX benchmark. Above 1920x1200 the game simply would not allow 4xAA. While the scores provide that the title could handle it, the option simply is not available. Though it isn't our norm, we chose to accept 2xAA so that we could get consistent readings across the spectrum of hardware.
Like most games before, HAWX scales exceptionally well at widescreen (though it's not needed). In most instances the cards scale very well. Widescreen scales in the 70% - 80% range. Eyefinity scales slightly less well. The 2GB 5870 scales at 50%-60%, while the 1GB cards only improves by 40%. The two lower cards are in the 65% - 70% range.
ATI Radeon CrossFireX Review - Heaven Demo
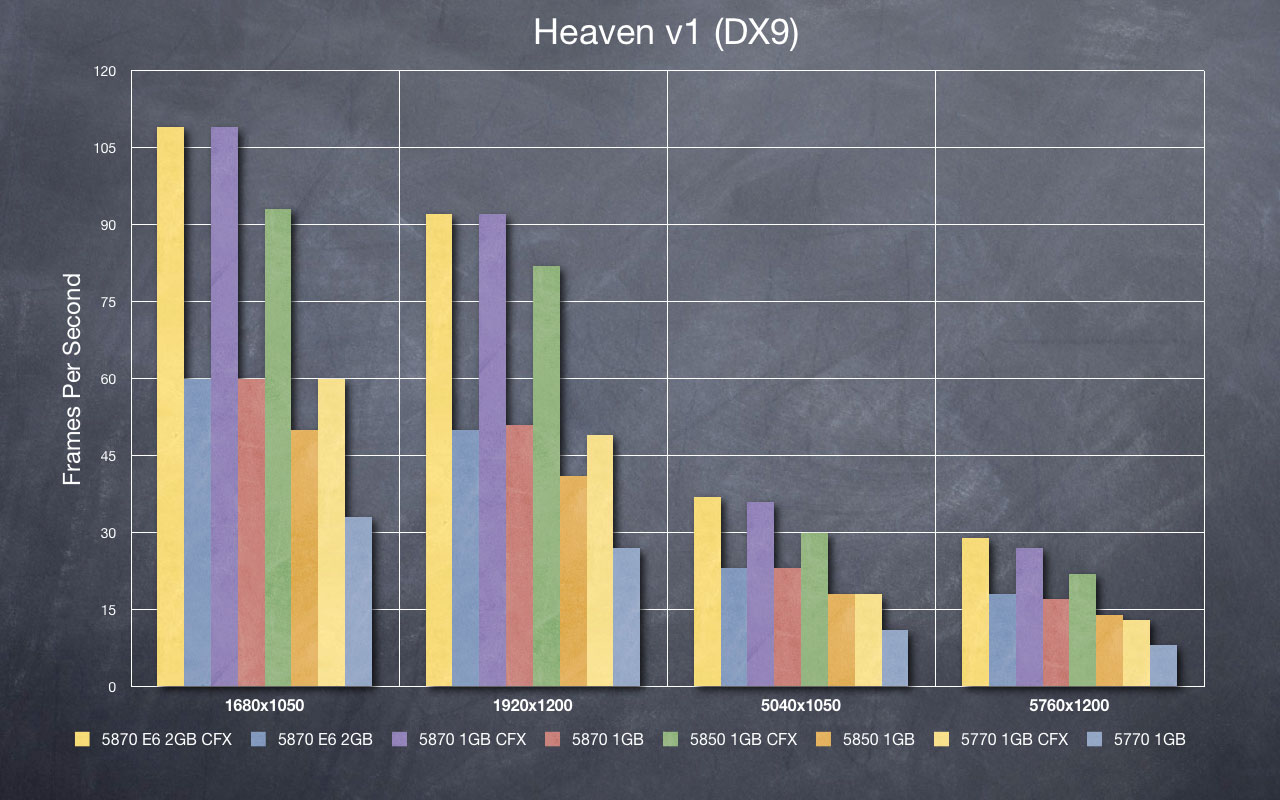
The Unigine Heaven Demo is unique in that it is the only demo which allows for the following components in one package.
- Synthetic Demo (i.e., a demo designed to "test" a system)
- Comparable tests of DX9, DX10 and DX11
- Is Hor+ (rather than limited to a few predefined aspect ratios)
The ability to compare DX9, DX10 and DX11 in the same environment allows for the unique ability to see how the different cards perform across these different comparable environments.
For the widescreen scores on the right side, I averaged the scores for the DX9, DX10 and DX11. They were also averaged for the Eyefinity scores on the 5870 2GB Eyefinity6 card. The remaining Eyefinity scores are only the DX9 scores. The percentage gains in the DX10 and DX11 scores (i.e., 1fps vs. 3fps - 300% increase) throws off the averages and isn't indicative of playable performance.
ATI Radeon CrossFireX Review - Heaven Demo (DX9)
CrossFireX Scaling
| HD 5870 E6 2GB CFX | ||
| 1680x1050 | 1920x1200 | |
| WS | 82% | 84% |
| EF | 73% | 70% |
EF is DX9 only for below cards
| HD 5870 1GB CFX | ||
| 1680x1050 | 1920x1200 | |
| WS | 82%% | 83% |
| EF | 57% | 59% |
| HD 5850 1GB CFX | ||
| 1680x1050 | 1920x1200 | |
| WS | 89% | 103% |
| EF | 67% | 57% |
| HD 5770 1GB CFX | ||
| 1680x1050 | 1920x1200 | |
| WS | 87% | 86% |
| EF | 64% | 63% |
The Unigine Heaven Demo is unique in that it is the only demo which allows for the following components in one package.
- Synthetic Demo (i.e., a demo designed to "test" a system)
- Comparable tests of DX9, DX10 and DX11
- Is Hor+ (rather than limited to a few predefined aspect ratios)
The ability to compare DX9, DX10 and DX11 in the same environment allows for the unique ability to see how the different cards perform across these different comparable environments.
For the widescreen scores on the right side, I averaged the scores for the DX9, DX10 and DX11. They were also averaged for the Eyefinity scores on the 5870 2GB Eyefinity6 card. The remaining Eyefinity scores are only the DX9 scores. The percentage gains in the DX10 and DX11 scores (i.e., 1fps vs. 3fps - 300% increase) throws off the averages and isn't indicative of playable performance.
ATI Radeon CrossFireX Review - Heaven Demo (DX10)
CrossFireX Scaling
| HD 5870 E6 2GB CFX | ||
| 1680x1050 | 1920x1200 | |
| WS | 82% | 84% |
| EF | 73% | 70% |
EF is DX9 only for below cards
| HD 5870 1GB CFX | ||
| 1680x1050 | 1920x1200 | |
| WS | 82%% | 83% |
| EF | 57% | 59% |
| HD 5850 1GB CFX | ||
| 1680x1050 | 1920x1200 | |
| WS | 89% | 103% |
| EF | 67% | 57% |
| HD 5770 1GB CFX | ||
| 1680x1050 | 1920x1200 | |
| WS | 87% | 86% |
| EF | 64% | 63% |
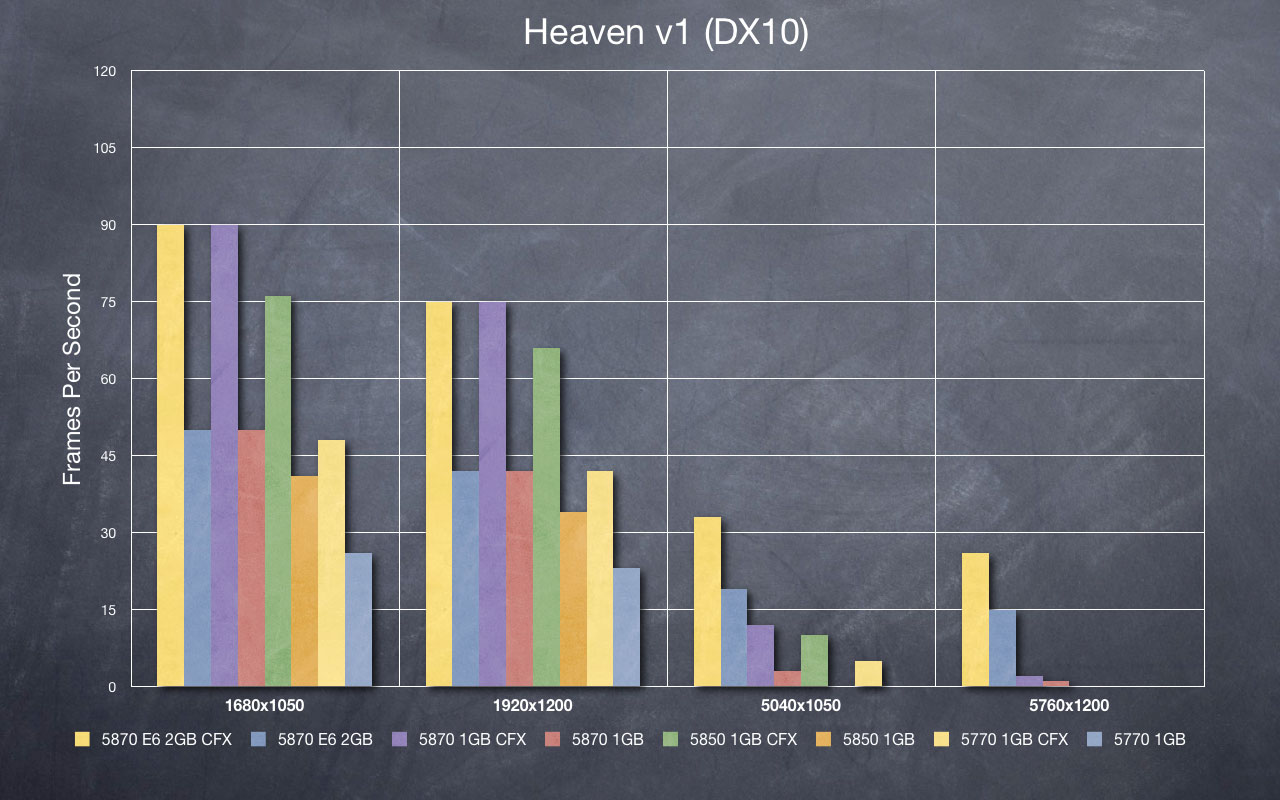
The Unigine Heaven Demo is unique in that it is the only demo which allows for the following components in one package.
- Synthetic Demo (i.e., a demo designed to "test" a system)
- Comparable tests of DX9, DX10 and DX11
- Is Hor+ (rather than limited to a few predefined aspect ratios)
The ability to compare DX9, DX10 and DX11 in the same environment allows for the unique ability to see how the different cards perform across these different comparable environments.
For the widescreen scores on the right side, I averaged the scores for the DX9, DX10 and DX11. They were also averaged for the Eyefinity scores on the 5870 2GB Eyefinity6 card. The remaining Eyefinity scores are only the DX9 scores. The percentage gains in the DX10 and DX11 scores (i.e., 1fps vs. 3fps - 300% increase) throws off the averages and isn't indicative of playable performance.
ATI Radeon CrossFireX Review - Heaven Demo (DX11)
CrossFireX Scaling
| HD 5870 E6 2GB CFX | ||
| 1680x1050 | 1920x1200 | |
| WS | 82% | 84% |
| EF | 73% | 70% |
EF is DX9 only for below cards
| HD 5870 1GB CFX | ||
| 1680x1050 | 1920x1200 | |
| WS | 82%% | 83% |
| EF | 57% | 59% |
| HD 5850 1GB CFX | ||
| 1680x1050 | 1920x1200 | |
| WS | 89% | 103% |
| EF | 67% | 57% |
| HD 5770 1GB CFX | ||
| 1680x1050 | 1920x1200 | |
| WS | 87% | 86% |
| EF | 64% | 63% |
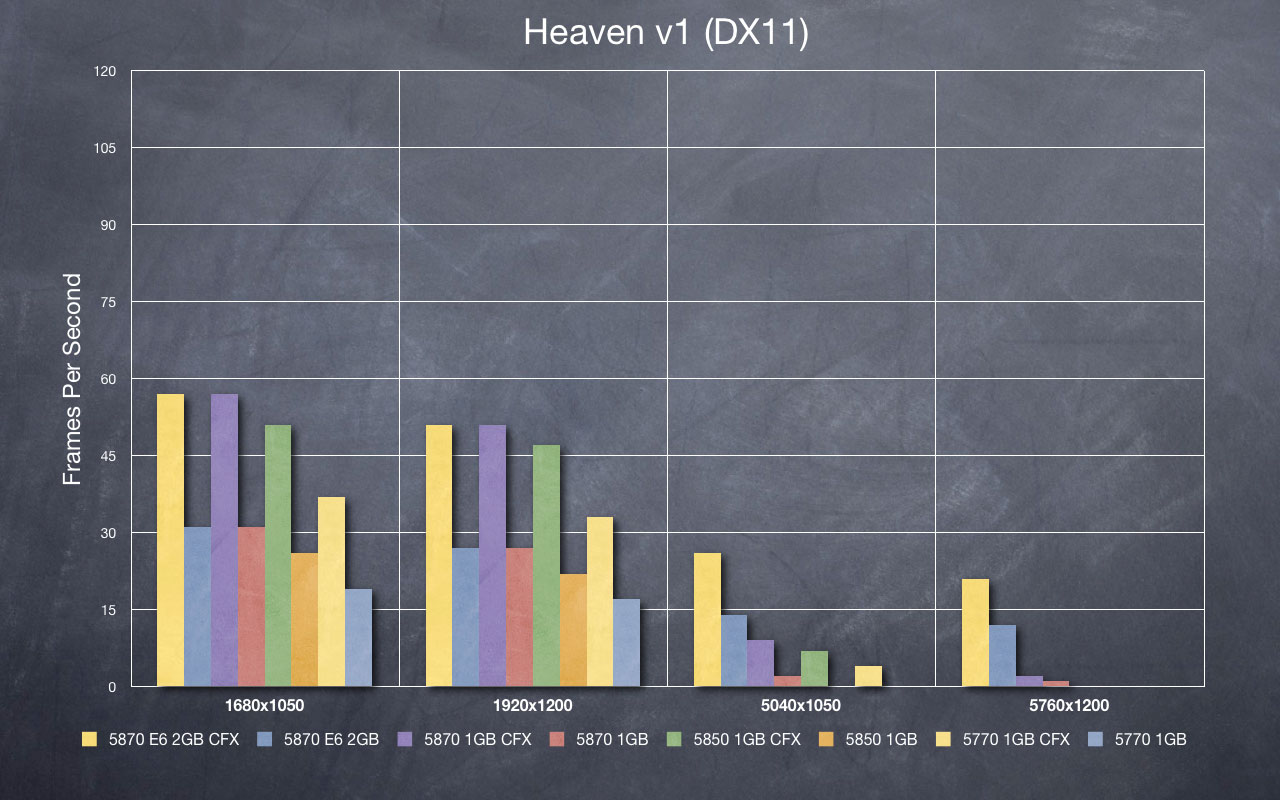
The Unigine Heaven Demo is unique in that it is the only demo which allows for the following components in one package.
- Synthetic Demo (i.e., a demo designed to "test" a system)
- Comparable tests of DX9, DX10 and DX11
- Is Hor+ (rather than limited to a few predefined aspect ratios)
The ability to compare DX9, DX10 and DX11 in the same environment allows for the unique ability to see how the different cards perform across these different comparable environments.
For the widescreen scores on the right side, I averaged the scores for the DX9, DX10 and DX11. They were also averaged for the Eyefinity scores on the 5870 2GB Eyefinity6 card. The remaining Eyefinity scores are only the DX9 scores. The percentage gains in the DX10 and DX11 scores (i.e., 1fps vs. 3fps - 300% increase) throws off the averages and isn't indicative of playable performance.
ATI Radeon CrossFireX Review - S.T.A.L.K.E.R.: Call of Pripyat
S.T.A.L.K.E.R. - Call of Pripyat is the new Crysis.
Prior to the game's release, the developer put out a benchmarking tool to test your system configuration. It offers a number of different options for utilizing DX9, 10 or 11 code paths. It also offers options for varying levels of HDAO and Shadow Quality. The demo itself isn't very pretty to look at (lots of dirt and dirt-colors), but it does put a beating on your system.
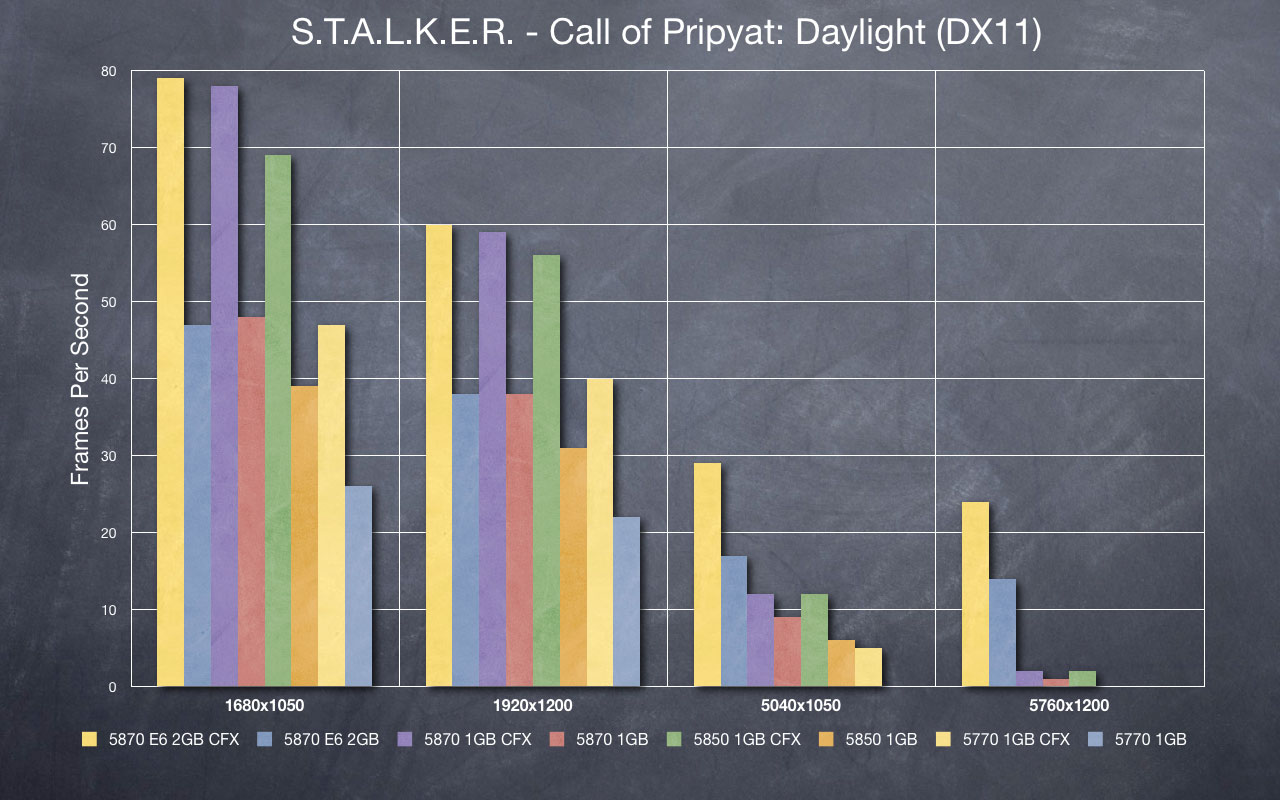
For the widescreen scores on the right side, I averaged the scores for all four tests. They were also averaged for the Eyefinity scores on the 5870 2GB Eyefinity6 card. The remaining Eyefinity scores are not posted. The percentage gains in the DX10 and DX11 scores (i.e., 1fps vs. 3fps - 300% increase) throws off the averages and isn't indicative of playable performance. The overall scaling averages 75% improvement for the areas reported.
ATI Radeon CrossFireX Review - S.T.A.L.K.E.R.: Call of Pripyat (Daylight)
CrossFireX Scaling
| HD 5870 E6 2GB CFX | ||
| 1680x1050 | 1920x1200 | |
| WS | 71% | 71% |
| 77% | 70% | 70% |
| HD 5870 1GB CFX | ||
| 1680x1050 | 1920x1200 | |
| WS | 66% | 67% |
| EF | ||
| HD 5850 1GB CFX | ||
| 1680x1050 | 1920x1200 | |
| WS | 78% | 75% |
| EF | ||
| HD 5770 1GB CFX | ||
| 1680x1050 | 1920x1200 | |
| WS | 79% | 78% |
| EF | ||
S.T.A.L.K.E.R. - Call of Pripyat is the new Crysis.
Prior to the game's release, the developer put out a benchmarking tool to test your system configuration. It offers a number of different options for utilizing DX9, 10 or 11 code paths. It also offers options for varying levels of HDAO and Shadow Quality. The demo itself isn't very pretty to look at (lots of dirt and dirt-colors), but it does put a beating on your system.
For the widescreen scores on the right side, I averaged the scores for all four tests. They were also averaged for the Eyefinity scores on the 5870 2GB Eyefinity6 card. The remaining Eyefinity scores are not posted. The percentage gains in the DX10 and DX11 scores (i.e., 1fps vs. 3fps - 300% increase) throws off the averages and isn't indicative of playable performance. The overall scaling averages 75% improvement for the areas reported.
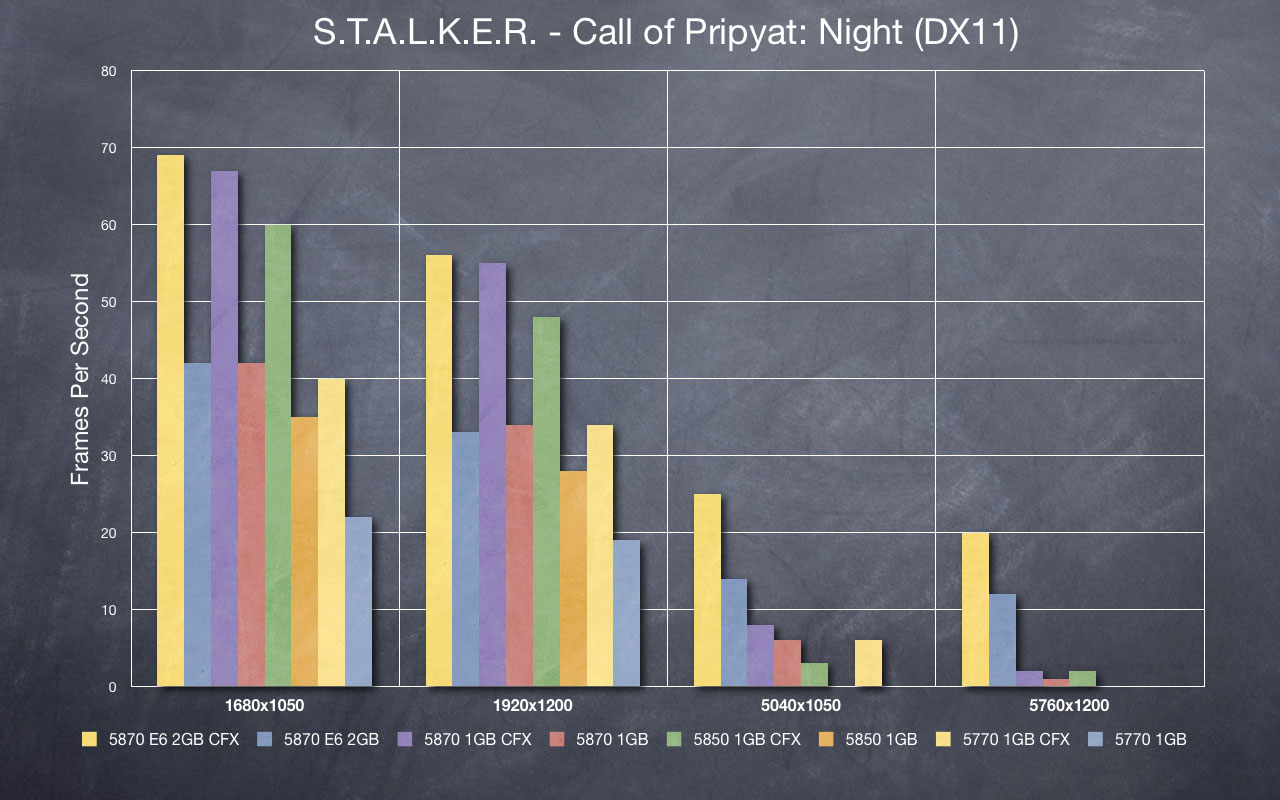
ATI Radeon CrossFireX Review - S.T.A.L.K.E.R.: Call of Pripyat (Night)
CrossFireX Scaling
| HD 5870 E6 2GB CFX | ||
| 1680x1050 | 1920x1200 | |
| WS | 71% | 71% |
| 77% | 70% | 70% |
| HD 5870 1GB CFX | ||
| 1680x1050 | 1920x1200 | |
| WS | 66% | 67% |
| EF | ||
| HD 5850 1GB CFX | ||
| 1680x1050 | 1920x1200 | |
| WS | 78% | 75% |
| EF | ||
| HD 5770 1GB CFX | ||
| 1680x1050 | 1920x1200 | |
| WS | 79% | 78% |
| EF | ||
S.T.A.L.K.E.R. - Call of Pripyat is the new Crysis.
Prior to the game's release, the developer put out a benchmarking tool to test your system configuration. It offers a number of different options for utilizing DX9, 10 or 11 code paths. It also offers options for varying levels of HDAO and Shadow Quality. The demo itself isn't very pretty to look at (lots of dirt and dirt-colors), but it does put a beating on your system.
For the widescreen scores on the right side, I averaged the scores for all four tests. They were also averaged for the Eyefinity scores on the 5870 2GB Eyefinity6 card. The remaining Eyefinity scores are not posted. The percentage gains in the DX10 and DX11 scores (i.e., 1fps vs. 3fps - 300% increase) throws off the averages and isn't indicative of playable performance. The overall scaling averages 75% improvement for the areas reported.
ATI Radeon CrossFireX Review - S.T.A.L.K.E.R.: Call of Pripyat (Rain)
CrossFireX Scaling
| HD 5870 E6 2GB CFX | ||
| 1680x1050 | 1920x1200 | |
| WS | 71% | 71% |
| 77% | 70% | 70% |
| HD 5870 1GB CFX | ||
| 1680x1050 | 1920x1200 | |
| WS | 66% | 67% |
| EF | ||
| HD 5850 1GB CFX | ||
| 1680x1050 | 1920x1200 | |
| WS | 78% | 75% |
| EF | ||
| HD 5770 1GB CFX | ||
| 1680x1050 | 1920x1200 | |
| WS | 79% | 78% |
| EF | ||
S.T.A.L.K.E.R. - Call of Pripyat is the new Crysis.
Prior to the game's release, the developer put out a benchmarking tool to test your system configuration. It offers a number of different options for utilizing DX9, 10 or 11 code paths. It also offers options for varying levels of HDAO and Shadow Quality. The demo itself isn't very pretty to look at (lots of dirt and dirt-colors), but it does put a beating on your system.
For the widescreen scores on the right side, I averaged the scores for all four tests. They were also averaged for the Eyefinity scores on the 5870 2GB Eyefinity6 card. The remaining Eyefinity scores are not posted. The percentage gains in the DX10 and DX11 scores (i.e., 1fps vs. 3fps - 300% increase) throws off the averages and isn't indicative of playable performance. The overall scaling averages 75% improvement for the areas reported.

ATI Radeon CrossFireX Review - S.T.A.L.K.E.R.: Call of Pripyat (Sun Shafts)
CrossFireX Scaling
| HD 5870 E6 2GB CFX | ||
| 1680x1050 | 1920x1200 | |
| WS | 71% | 71% |
| 77% | 70% | 70% |
| HD 5870 1GB CFX | ||
| 1680x1050 | 1920x1200 | |
| WS | 66% | 67% |
| EF | ||
| HD 5850 1GB CFX | ||
| 1680x1050 | 1920x1200 | |
| WS | 78% | 75% |
| EF | ||
| HD 5770 1GB CFX | ||
| 1680x1050 | 1920x1200 | |
| WS | 79% | 78% |
| EF | ||
S.T.A.L.K.E.R. - Call of Pripyat is the new Crysis.
Prior to the game's release, the developer put out a benchmarking tool to test your system configuration. It offers a number of different options for utilizing DX9, 10 or 11 code paths. It also offers options for varying levels of HDAO and Shadow Quality. The demo itself isn't very pretty to look at (lots of dirt and dirt-colors), but it does put a beating on your system.
For the widescreen scores on the right side, I averaged the scores for all four tests. They were also averaged for the Eyefinity scores on the 5870 2GB Eyefinity6 card. The remaining Eyefinity scores are not posted. The percentage gains in the DX10 and DX11 scores (i.e., 1fps vs. 3fps - 300% increase) throws off the averages and isn't indicative of playable performance. The overall scaling averages 75% improvement for the areas reported.
